Fretboard diagrams are a grid-like format used to show some portion of the guitar fretboard, with certain notes labeled or highlighted. They give us an at-a-glance viewpoint of the notes we might use in a scale, arpeggio, chord, or riff.
Unlike tabs, they don’t explicitly tell us the order to play each highlighted note! Rather, they give us an inventory of the notes available we might use in whatever we’re playing.
Here’s a few examples of what fretboard diagrams look like. Here’s some that are vertical in orientation (strings going up and down):

And here’s some that are horizontal in their orientation (strings going left to right):
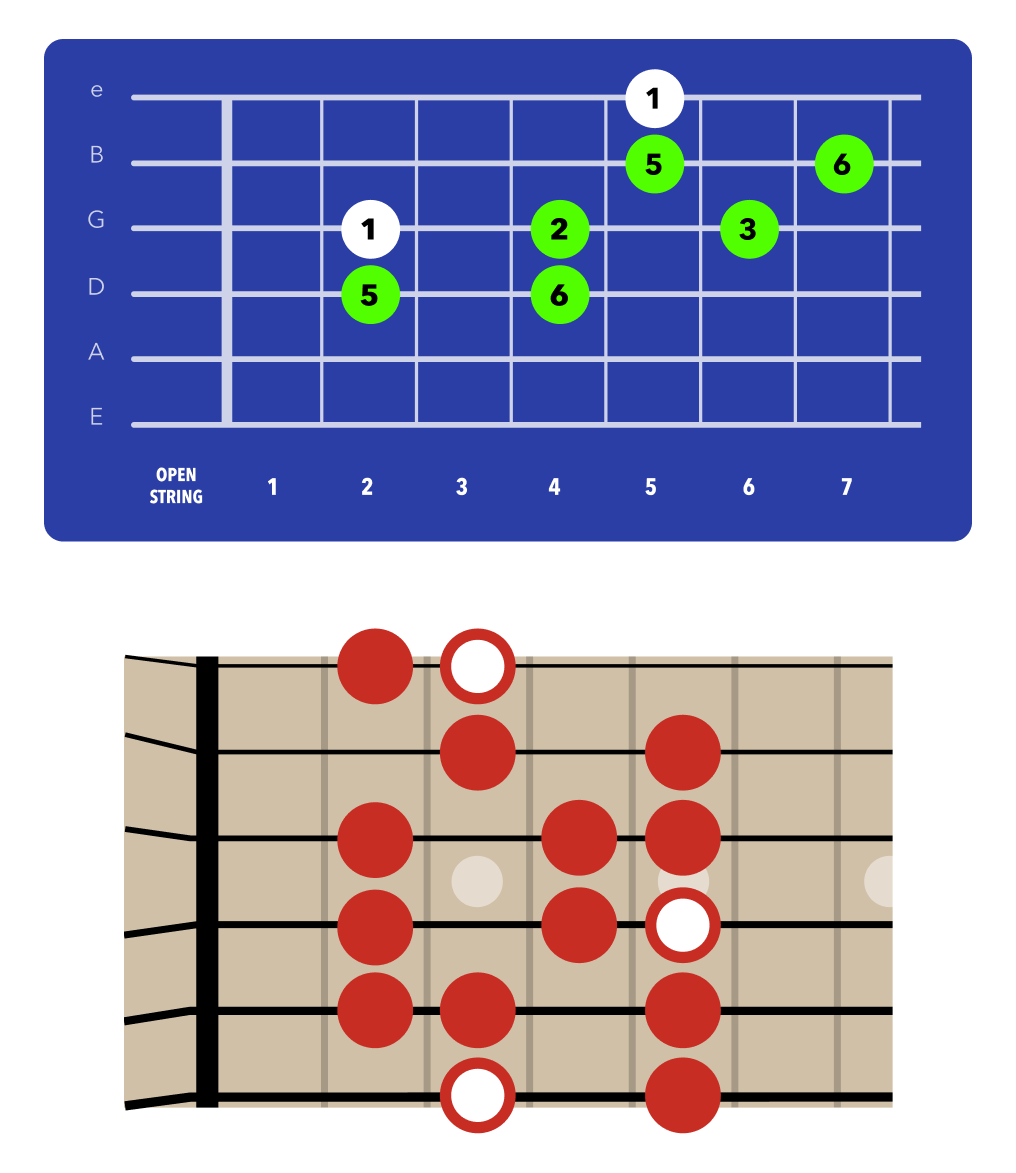
Fretboard diagrams always show the six guitar strings going in one direction, with fret markers shown along the opposite axis.
When shown vertically, the thickest string is on the left.

When shown horizontally, the thickest string is on the bottom (identical to guitar tabs).

On top of the grid you’ll see dots, which are placed on some (or all) of the strings. Each dot represents a specific note being used in whatever we’re playing.
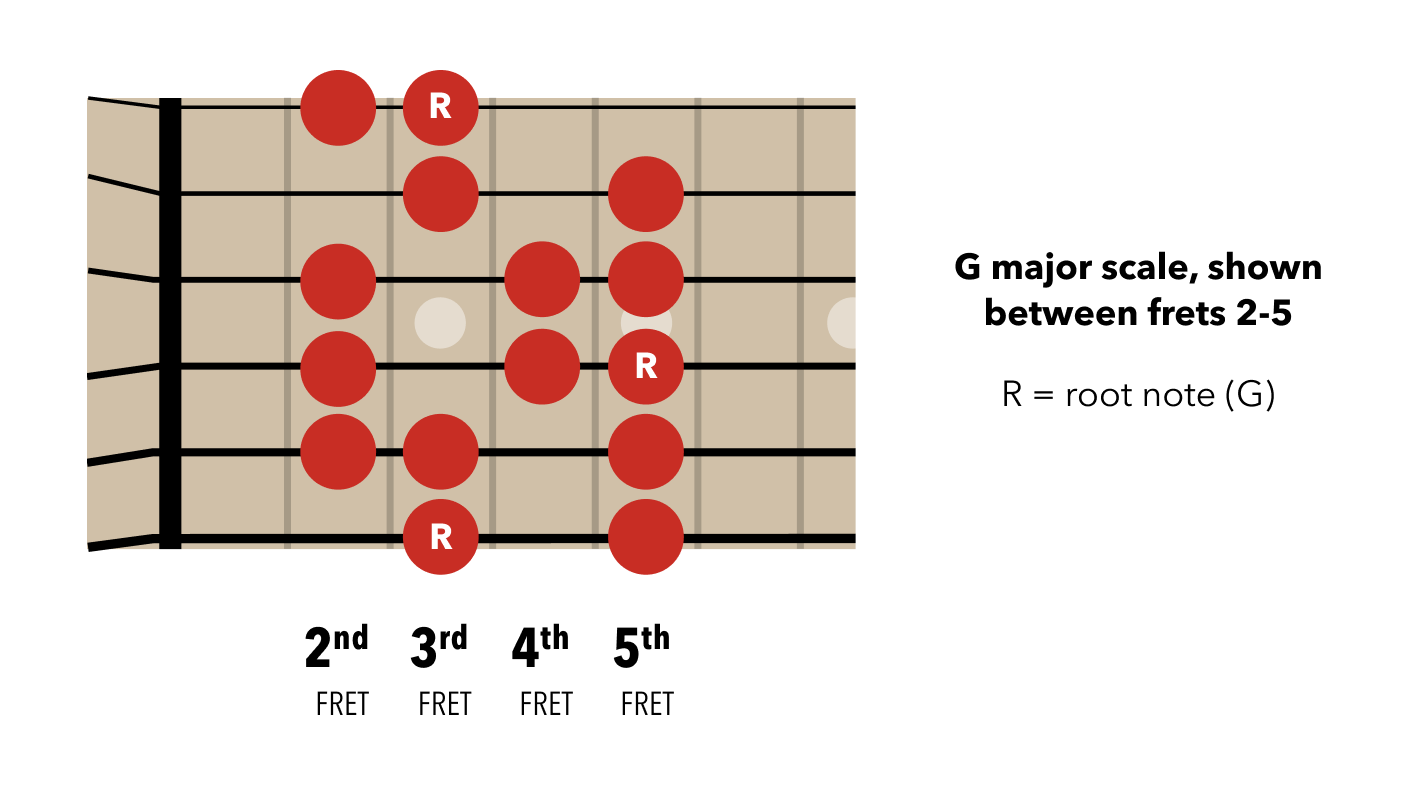
For example, here’s the notes in the G major scale shown between frets 2-5.
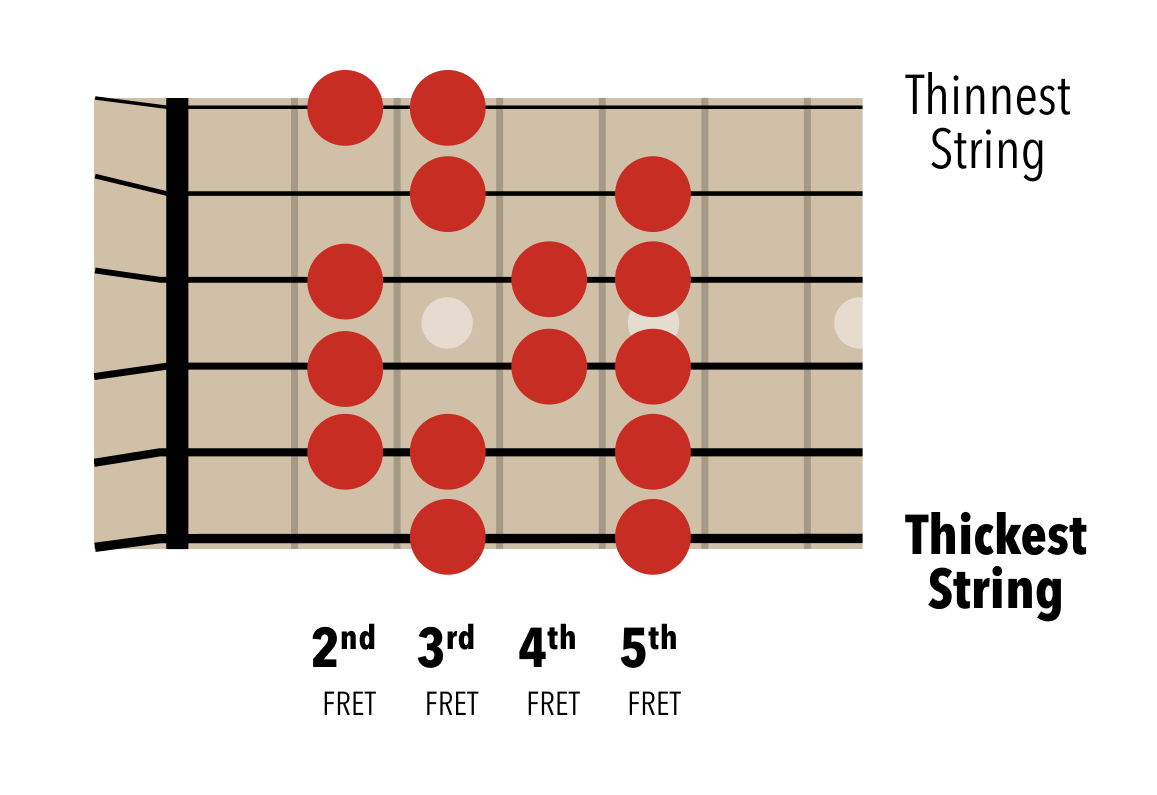
Usually, you do not play all the notes (dots) at the same time. You also are not expected to fret (i.e. push down) all the notes at once.
This is very important to understand!
Instead, think of the dotted notes as ingredients you’ll be using, similar to cooking. Each ingredient has its place, you’ll use some more than others. In this light, fretboard diagrams are similar to an ingredient list – which give you an inventory of everything you’ll be using. This can be incredibly helpful when learning something!
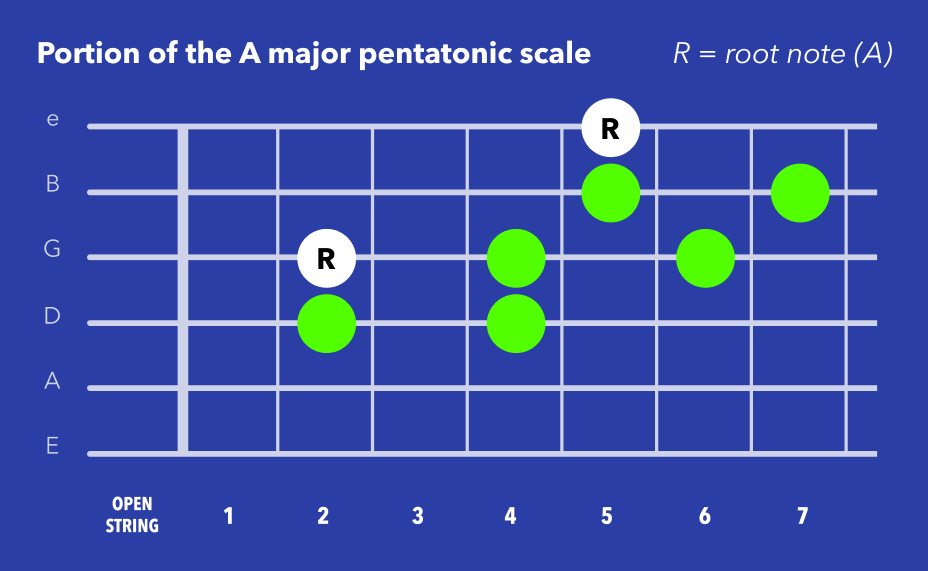
For example, here’s a portion of the A major pentatonic scale, shown in a single area of the fretboard. You might be learning a song that has several licks built using this cluster notes. An example here is Amie by Pure Prairie League, which I have a lesson for!
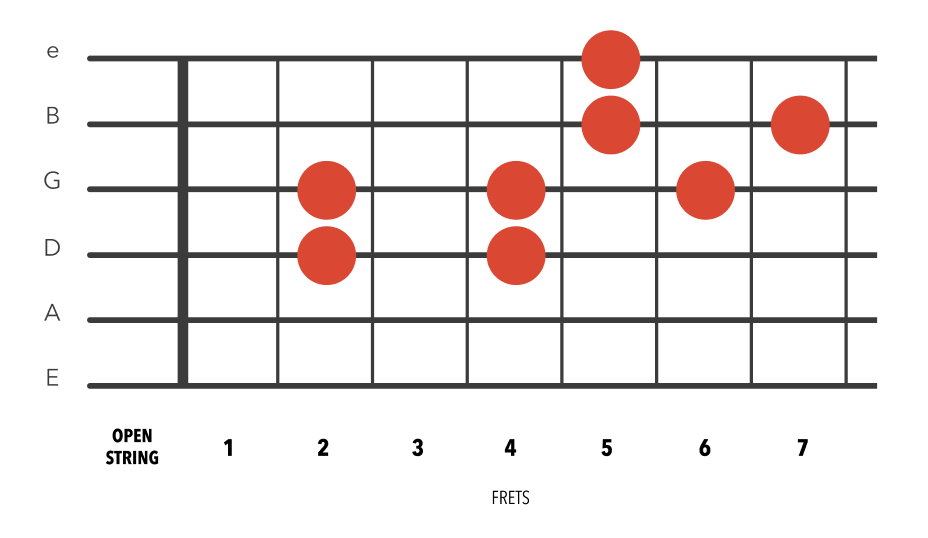
Each phrase in the intro to that song uses some (or all) of the notes shown above. But – they’re always combined in different ways, which tabs will show you separately. But just the same, it can be worth seeing this at a glance view of all the notes being used.
The only time you do play all the notes at the same time is when looking at a chord chart, which is indeed a type of fretboard diagram.
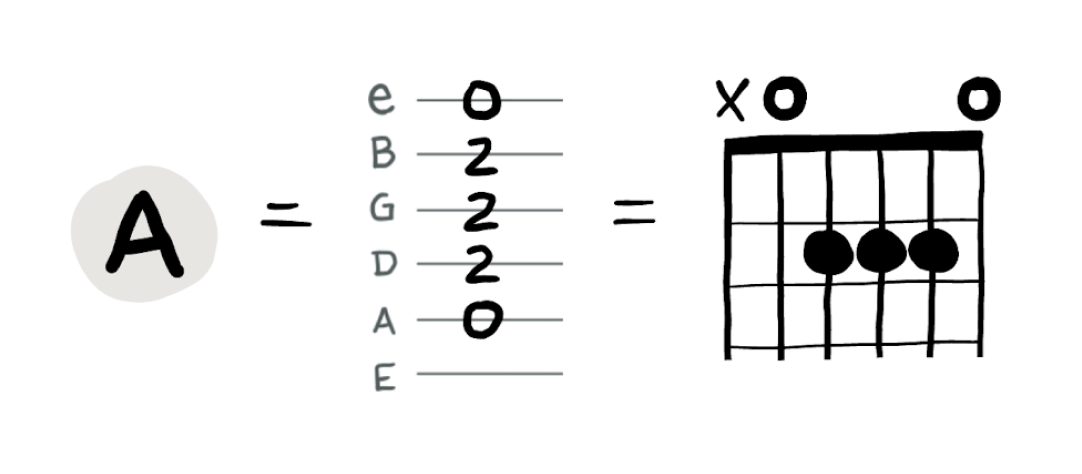
Chord charts tell you where to put the fingers on your fretting hand, so you can then play all the notes at once. For example, here’s an A major chord shown using a horizontal fretboard diagram:
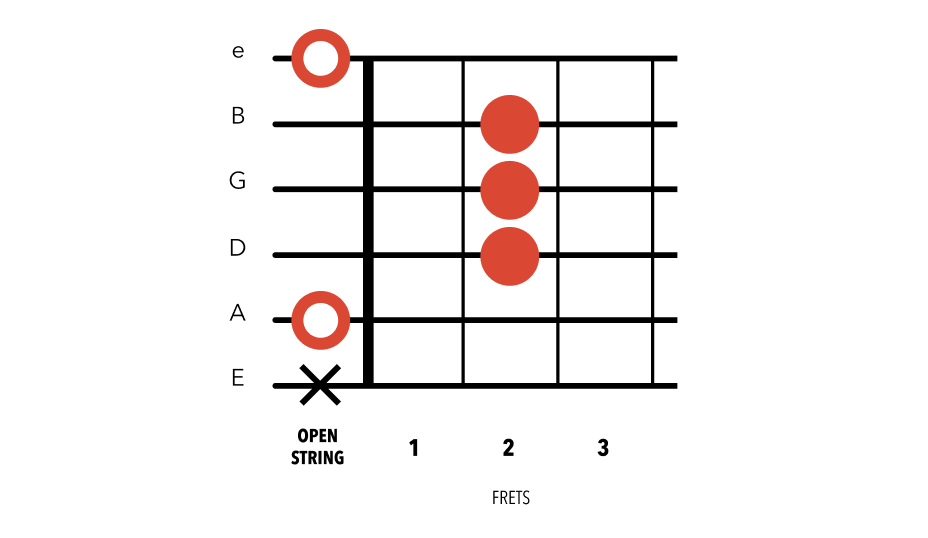
Typically, chord charts are shown vertically (with strings going up-and-down). Here’s the same A major chord shown in this more common format:
Fretboard diagrams should be thought of like a map, showing us a spatial representation of specific notes on the fretboard. The guitar fretboard, similar to a game of chess or checkers, often involves patterns of notes — and seeing these patterns can be immensely helpful when learning guitar.
A few ways fretboard diagrams are used:
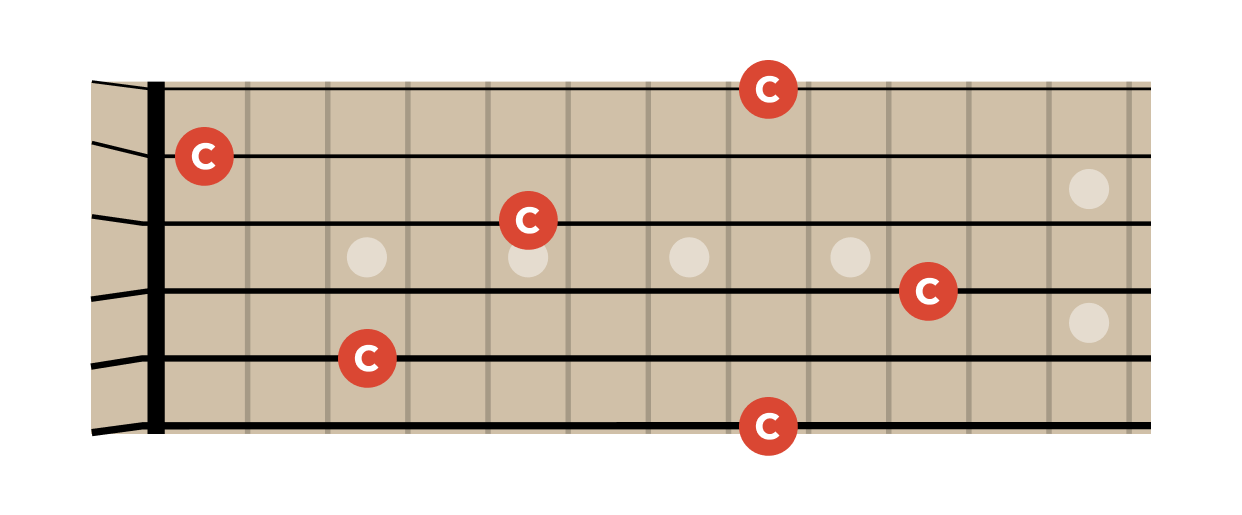

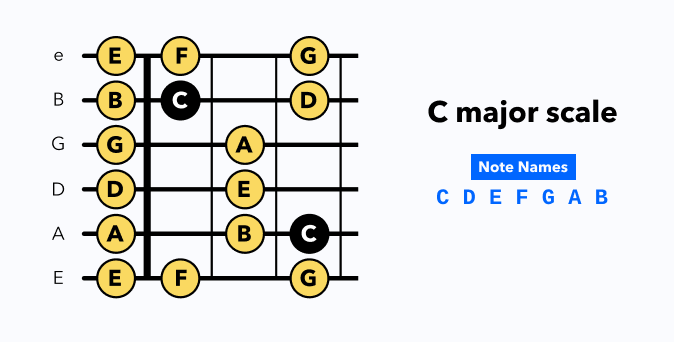
Sometimes, you’ll see dots labeled with the name of each note. This directly communicates which note each dot represents. For learning the fretboard, this is incredibly valuable. Here’s the notes in the C major scale, shown in the first few frets:
Other times, we’ll see numbers on each dot. This often represents the scale degree (or interval) of each note, which tell us how far each note is from the root note of whatever we’re playing.
For example, the same seven notes in the C major scale might also be shown like this, where each number represents that note’s order in the scale:

This might seem confusing at first, but it’s absolutely worth learning when you’re ready. This is because the notes in each key are different — but the the pattern of scale degrees is 100% consistent no matter which key we’re in.
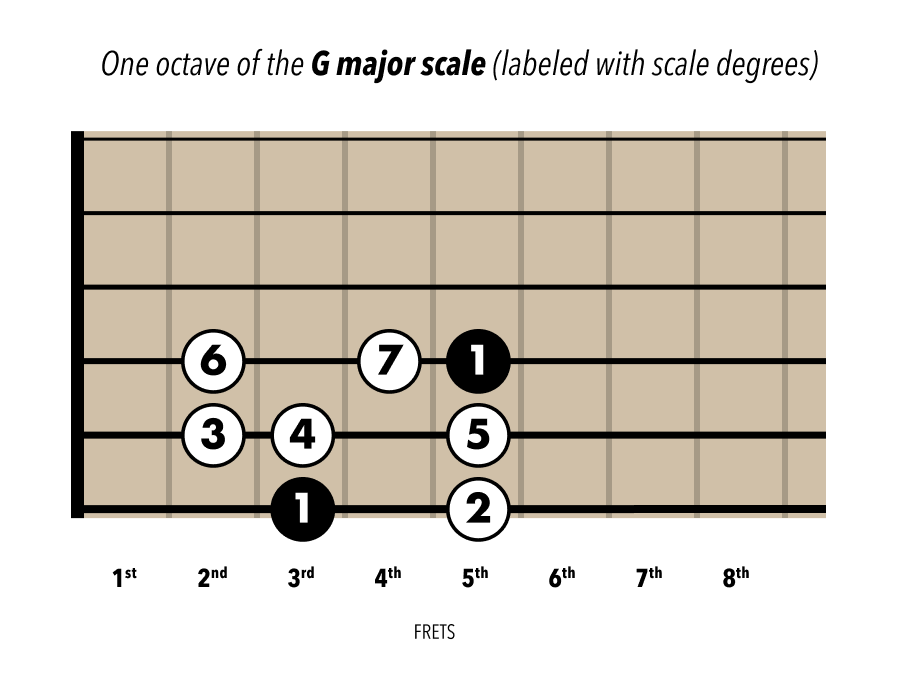
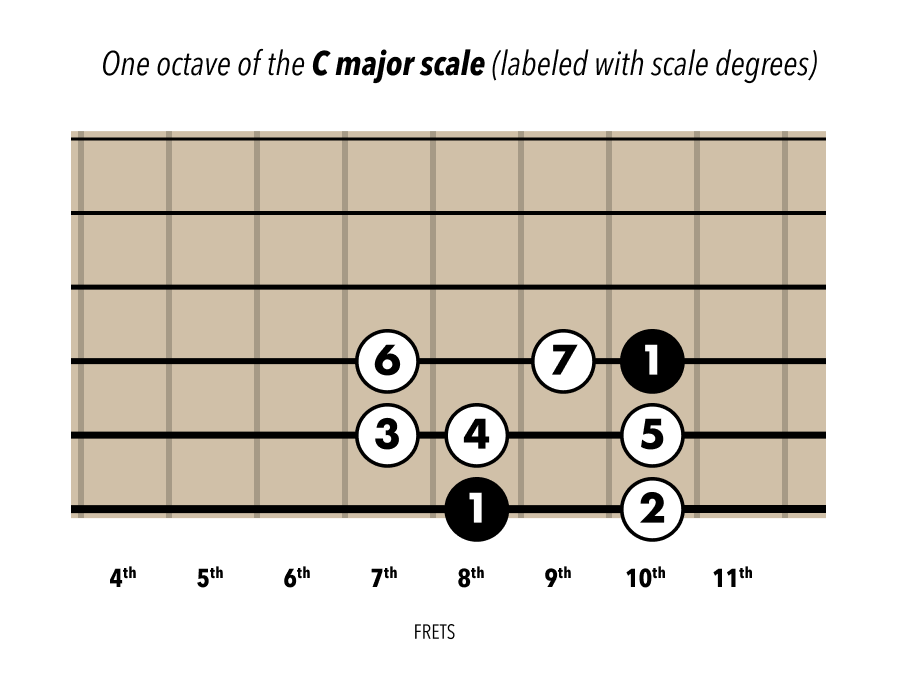
For example, look at this major scale pattern shown in three different keys. The frets you use are different, but the pattern of notes is the exact same in all keys. Learn the pattern once, use it anywhere!

Next Lesson: How to Read Chord Progressions →